99%的焦虑都来自于虚度时间和没有好好做事,所以唯一的解决办法就是行动起来,认真做完事情,战胜焦虑,战胜那些心里空荡荡的时刻,而不是选择逃避。不要站在原地想象困难,行动永远是改变现状的最佳方式
写在前面
博文内容涉及 Prometheus、node-exporter、Grafana docker 和 k8s 两种容器话部署方案
理解不足小伙伴帮忙指正 :),生活加油
99%的焦虑都来自于虚度时间和没有好好做事,所以唯一的解决办法就是行动起来,认真做完事情,战胜焦虑,战胜那些心里空荡荡的时刻,而不是选择逃避。不要站在原地想象困难,行动永远是改变现状的最佳方式
持续分享技术干货,感兴趣小伙伴可以关注下 ^_^
docker 部署 创建一个专用网络,这个网络一般是业务对应网络
1
2
[root@ecs-hce ] 8858411315a892cd61bbe8b31411595dd8b013792fd05ab68806f3ca5572c3a7
部署 Prometheus 下载 Prometheus 镜像, 查看 Prometheus 镜像
1
2
3
4
5
6
7
8
9
10
11
12
13
14
15
16
17
18
19
[root@ecs-hce ~] Using default tag: latest latest: Pulling from prom/prometheus 9fa9226be034: Pull complete 1617e25568b2: Pull complete 0af4f5a1aba4: Pull complete 524450aac7ac: Pull complete 3427b0266353: Pull complete 87f5816afa35: Pull complete fe81a20504a7: Pull complete bfac845c5ca1: Pull complete 6c1aa870016a: Pull complete 6126ba6f9b4f: Pull complete 68d61c64cf66: Pull complete 5e5897603b11: Pull complete Digest: sha256:beb5e30ffba08d9ae8a7961b9a2145fc8af6296ff2a4f463df7cd722fcbfc789 Status: Downloaded newer image for prom/prometheus:latest [root@ecs-hce ~] prom/prometheus latest 2a72b385beaf 3 weeks ago 250MB
启动 Prometheus 容器, 这里需要注意端口和网络
1
2
[root@ecs-hce ~] b1f8fb907b6963e84df3e9ca1cb7e190d9089e582ebff20956c33321fcbd219c
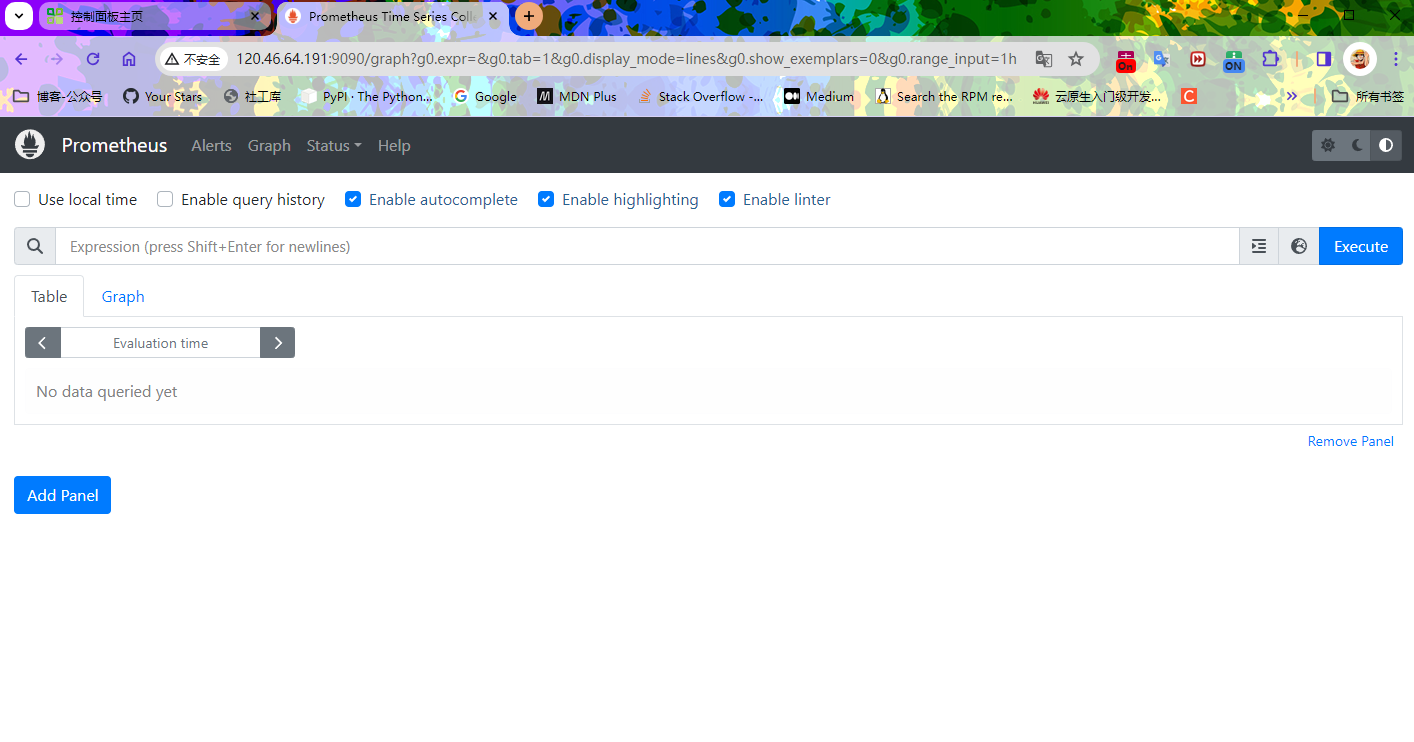
验证 Prometheus,在浏览器输入 EIP:9090 访问 Prometheus
点击 Endpoint 下的链接,此时会发现页面无法访问,需要修改配置文件
1
2
3
4
5
6
7
8
9
10
11
12
13
14
[root@ecs-hce ~] [root@ecs-hce ~] [root@ecs-hce ~] ```yaml scrape_configs: - job_name: "prometheus" static_configs: - targets: ["localhost:9090" ]
修改 targets 对应的值为 eip:9090,并且保存退出
1
2
3
4
5
6
7
8
9
scrape_configs: - job_name: "prometheus" static_configs: - targets: ["120.46.64.191:9090" ]
停止 prom 容器,删除 prom 容器,重新启动 Prometheus 容器
1
2
3
4
[root@ecs-hce ~] prom [root@ecs-hce ~] prom
需要注意 -v /root/prometheus/prometheus.yml:/etc/prometheus/prometheus.yml,这里直接映射的文件
1
2
3
[root@ecs-hce ~] 08905b1011feb7e98431f53e53eadf8f5bb1ce6d44eb0894fb13b9598efa4c1f [root@ecs-hce ~]
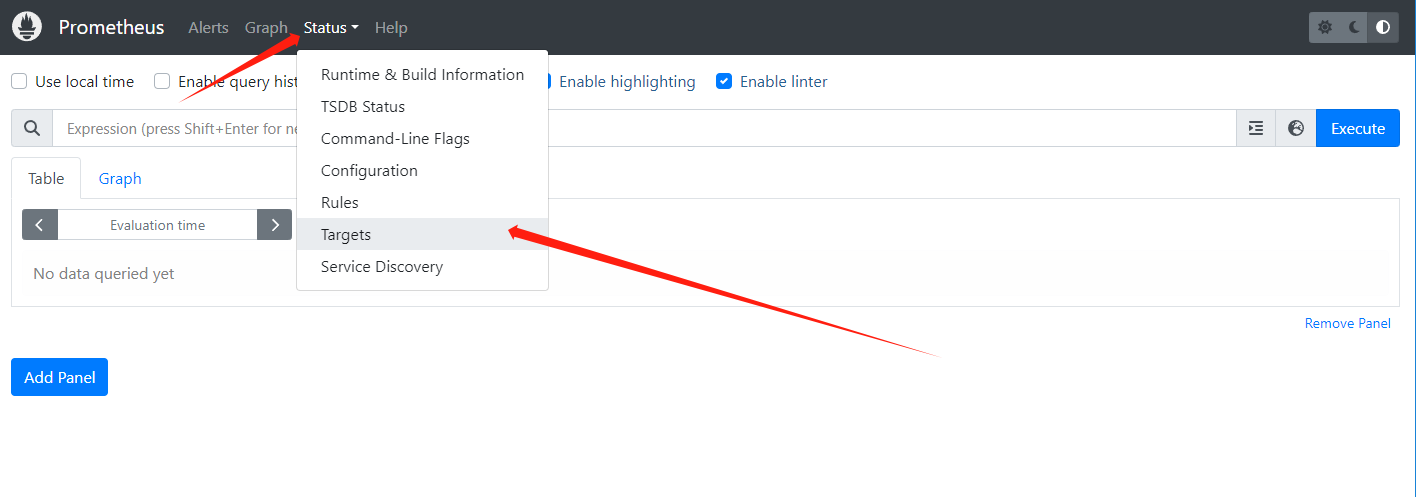
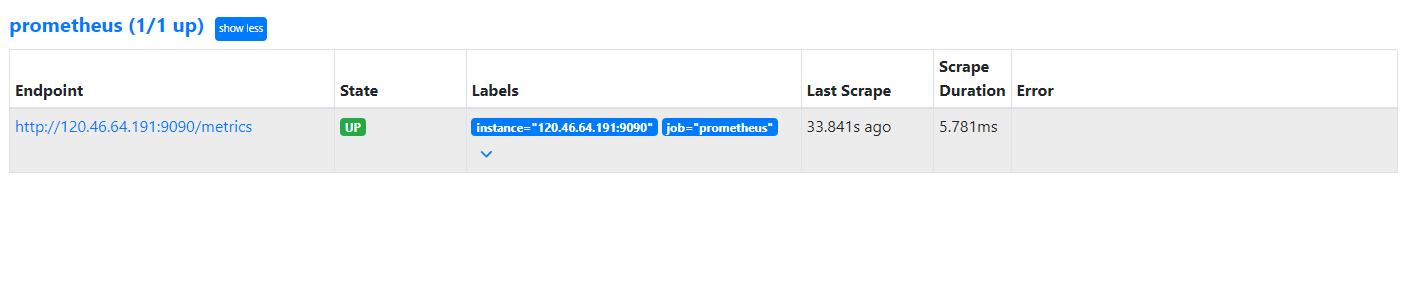
通过 EIP:9090 访问 Prometheus,并进入 Status 选项下 Targets 页面
部署 node-exporter 下载 node-exporter 镜像
1
2
3
4
5
6
7
8
[root@ecs-hce ~] Using default tag: latest latest: Pulling from prom/node-exporter 2abcce694348: Pull complete 455fd88e5221: Pull complete 324153f2810a: Pull complete Digest: sha256:4cb2b9019f1757be8482419002cb7afe028fdba35d47958829e4cfeaf6246d80 Status: Downloaded newer image for prom/node-exporter:latest
启动 node-exporter,注意网络和端口配置
1
2
[root@ecs-hce ~] 933a43e1cebbdc2192928c69b0e0f60faf84156601caed0548f08cafe979923d
修改 Prometheus 配置文件,重新启动 prometheus
1
2
3
4
5
6
7
8
9
10
11
12
13
14
15
scrape_configs: - job_name: "node-exporter" static_configs: - targets: ["120.46.64.191:9100" ] - job_name: "prometheus" static_configs: - targets: ["120.46.64.191:9090" ] [root@ecs-hce ~ ] prom [root@ecs-hce ~ ]
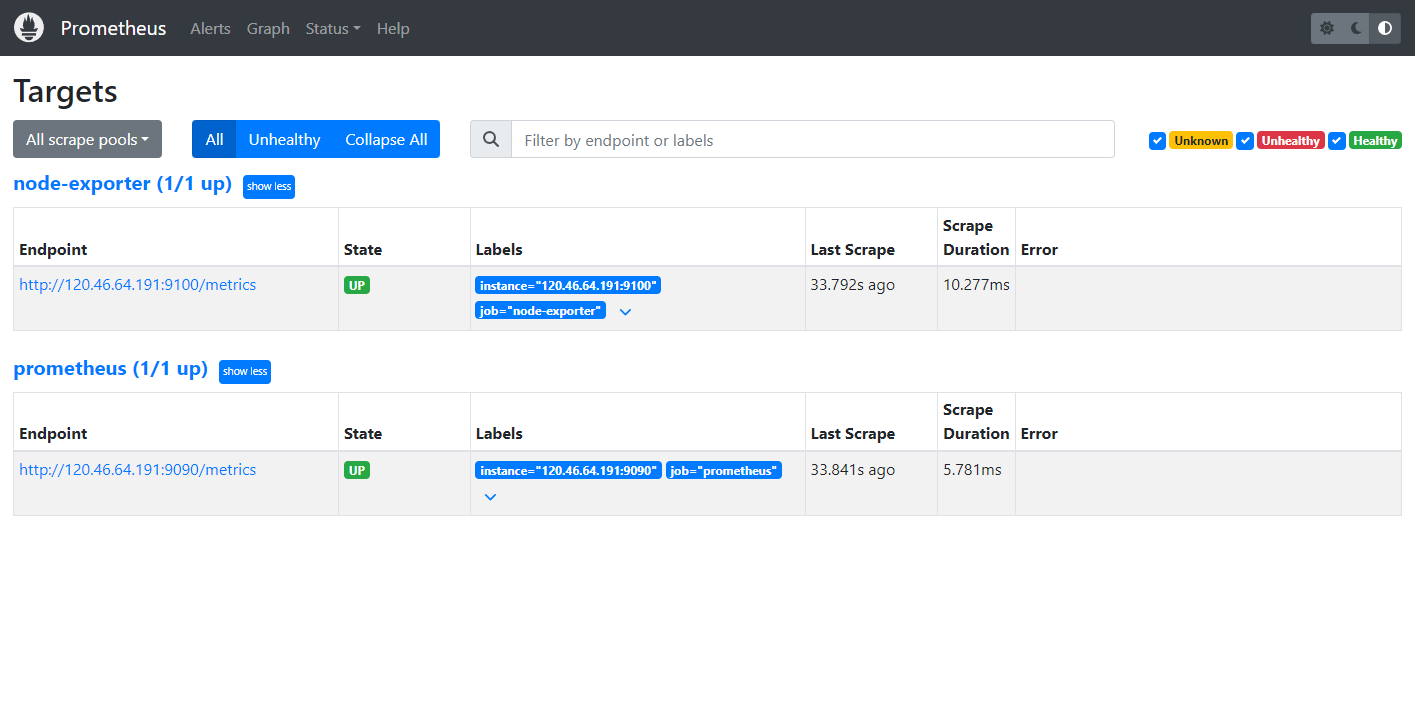
通过 EIP:9090 访问 Prometheus,在 Status—Targets 页面下,可以看到新配置的 node-exporter 数据源。
部署 Grafana 下载 Grafana 镜像
1
2
3
4
5
6
7
8
9
10
11
12
13
14
15
16
17
18
19
20
21
22
[root@ecs-hce ~] Using default tag: latest latest: Pulling from grafana/grafana 96526aa774ef: Pull complete c7ba78600384: Pull complete c27e091f8ead: Pull complete 1d06c4d0ba22: Pull complete 183afb97c8c4: Pull complete 409b84eddcee: Pull complete 10a0006e04fc: Downloading [==========> ] 11.79MB/53.8MB 24decdaaac3e: Download complete 10a0006e04fc: Pull complete 24decdaaac3e: Pull complete e178ee908fb8: Pull complete d42dc690a758: Pull complete Digest: sha256:7567a7c70a3c1d75aeeedc968d1304174a16651e55a60d1fb132a05e1e63a054 Status: Downloaded newer image for grafana/grafana:latest [root@ecs-hce ~] [root@ecs-hce ~] [root@ecs-hce ~] REPOSITORY TAG IMAGE ID CREATED SIZE grafana/grafana latest 2fec87cd4362 2 weeks ago 406MB
启动 Grafana 容器,注意这里的端口和网络,grafana 并不需要和上面的组件放到同一个网络里面
1
2
3
[root@ecs-hce ~] ab78373b51595e6de467d2e42f119309f9a301ff31e7ed89525334f7e0ed5e47 [root@ecs-hce ~]
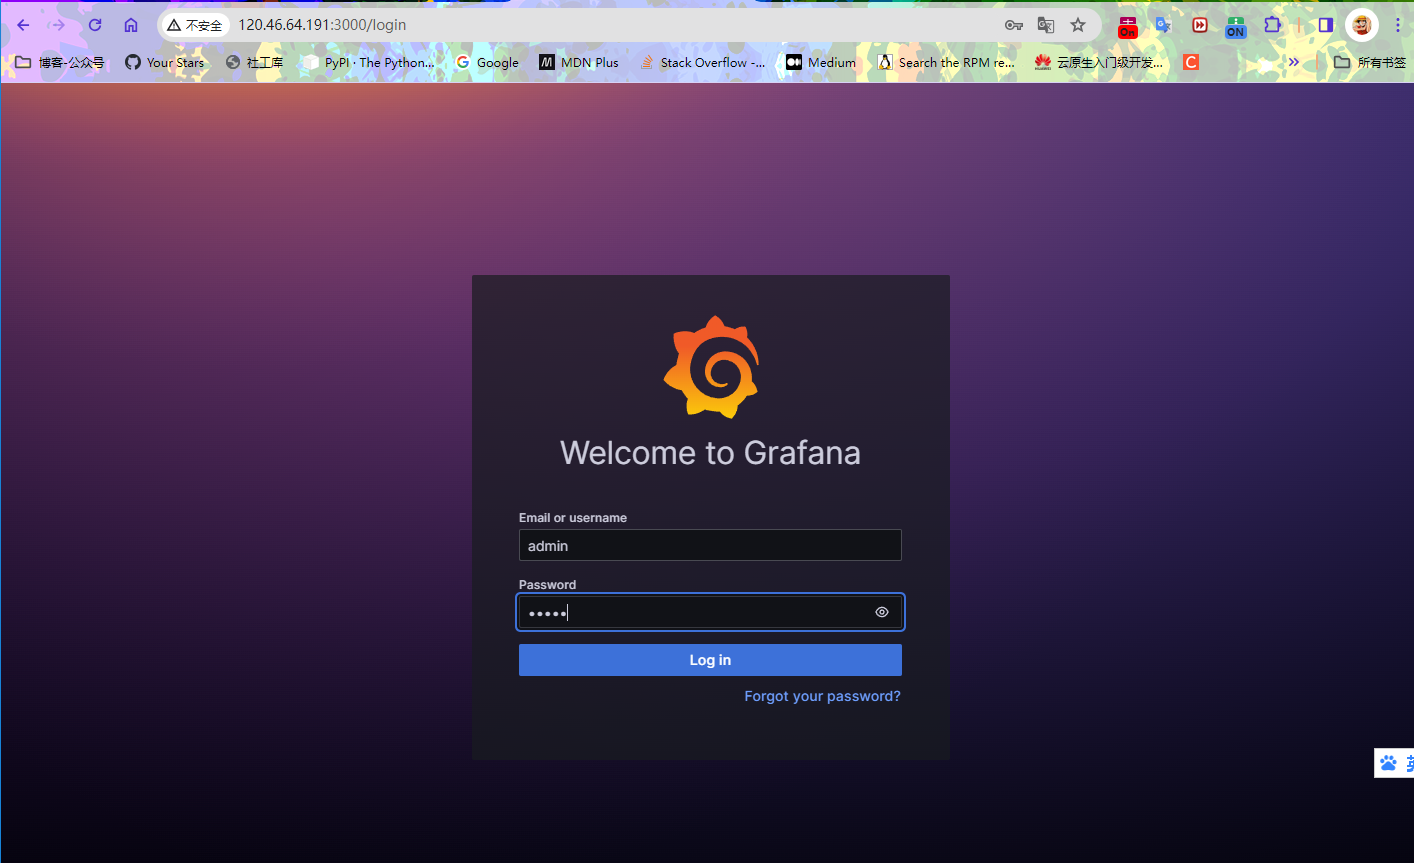
通过 EIP:3000 访问 Grafana,初始账号为 admin,密码为 admin
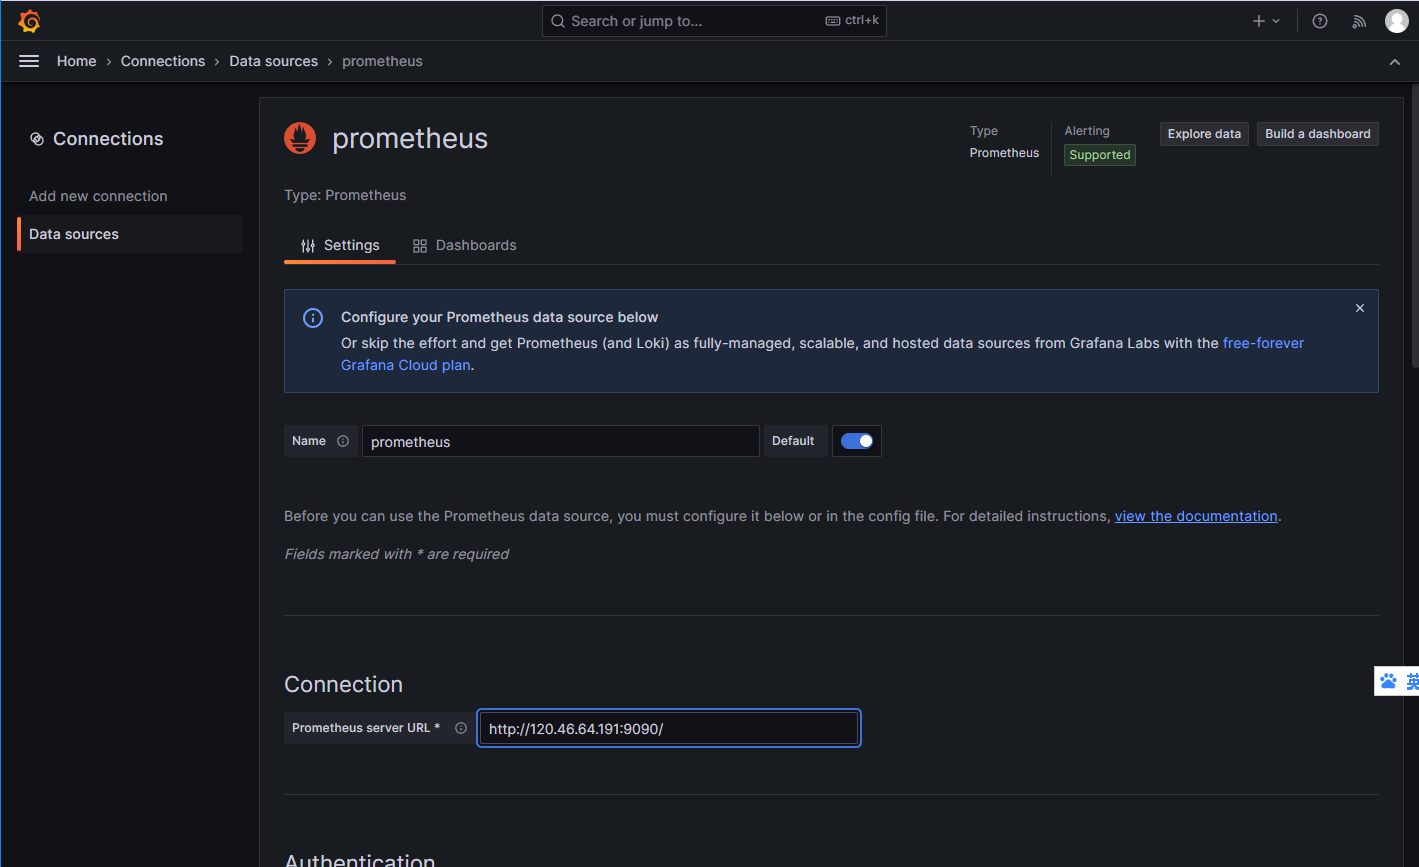
登录后,DATA SOURCE,增加数据源
到这里容器化部署Prometheus、node-exporter、Grafana就完成了,之后可以根据情况配置面板
k8s 部署 需要安装监控(Metrics Server),这里不多讲
1
2
curl -Ls https://api.github.com/repos/kubernetes-sigs/metrics-server/tarball/v0.3.6 -o metrics-server-v0.3.6.tar.gz
kube-prometheus-stack helm 方式安装 k8s 环境安装有封装好的 helm chart kube-prometheus-stack-30.0.1
获取地址:
https://github.com/prometheus-community/helm-charts/releases/download/kube-prometheus-stack-30.0.1/kube-prometheus-stack-30.0.1.tgz
镜像拉不了的问题,直接替换不好找,这里把 charts 包下载下来,然后通过 helm template 转化为具体的 yaml 文件。替换对应的镜像。
但是这样还一个问题,一些 CRD 不会预先安装,尤其是多 master 的情况,这里你可以多试几次,说不定就可以了,github上有人提了,貌似没有很好的解决方案,我的解决办法是先用 helm 安装,然后卸载,卸载的时候不会卸载 crd,然后在运行 生成的 yaml 文件。
1
2
3
4
5
6
7
8
9
10
┌──[root@vms100.liruilongs.github.io]-[~/ansible/helm] └─$cd kube-prometheus-stack ┌──[root@vms100.liruilongs.github.io]-[~/ansible/helm/kube-prometheus-stack] └─$ls Chart.lock charts Chart.yaml CONTRIBUTING.md crds README.md templates values.yaml ┌──[root@vms100.liruilongs.github.io]-[~/ansible/helm/kube-prometheus-stack] └─$helm install kube-prometheus-stack . ┌──[root@vms100.liruilongs.github.io]-[~/ansible/helm/kube-prometheus-stack] └─$helm template . > ../kube-prometheus-stack.yaml
执行应用
1
2
┌──[root@vms100.liruilongs.github.io]-[~/ansible/helm] └─$kubectl apply -f kube-prometheus-stack.yaml
执行完需要修改svc 为 NodePort 当然如果有 Ingress 控制器,或者 LB ,可以配置其他类型。
1
2
3
4
5
6
7
8
9
10
11
12
┌──[root@vms100.liruilongs.github.io]-[~/ansible/helm] └─$kubectl get svc NAME TYPE CLUSTER-IP EXTERNAL-IP PORT(S) AGE alertmanager-operated ClusterIP None <none> 9093/TCP,9094/TCP,9094/UDP 27m kubernetes ClusterIP 10.96.0.1 <none> 443/TCP 40h prometheus-operated ClusterIP None <none> 9090/TCP 27m release-name-grafana NodePort 10.111.188.209 <none> 80:30203/TCP 30m release-name-kube-promethe-alertmanager ClusterIP 10.97.17.175 <none> 9093/TCP 30m release-name-kube-promethe-operator ClusterIP 10.107.60.174 <none> 443/TCP 30m release-name-kube-promethe-prometheus ClusterIP 10.108.163.61 <none> 9090/TCP 30m release-name-kube-state-metrics ClusterIP 10.102.37.208 <none> 8080/TCP 30m release-name-prometheus-node-exporter ClusterIP 10.100.5.155 <none> 9100/TCP 30m
登录用户名和密码获取
1
2
3
4
5
6
┌──[root@vms100.liruilongs.github.io]-[~/ansible/helm] └─$kubectl get secrets release-name-grafana -o jsonpath='{.data.admin-user}' | base64 -d admin┌──[root@vms100.liruilongs.github.io]-[~/ansible/helm] └─$kubectl get secrets release-name-grafana -o jsonpath='{.data.admin-password}' | base64 -d prom-operator┌──[root@vms100.liruilongs.github.io]-[~/ansible/helm] └─$
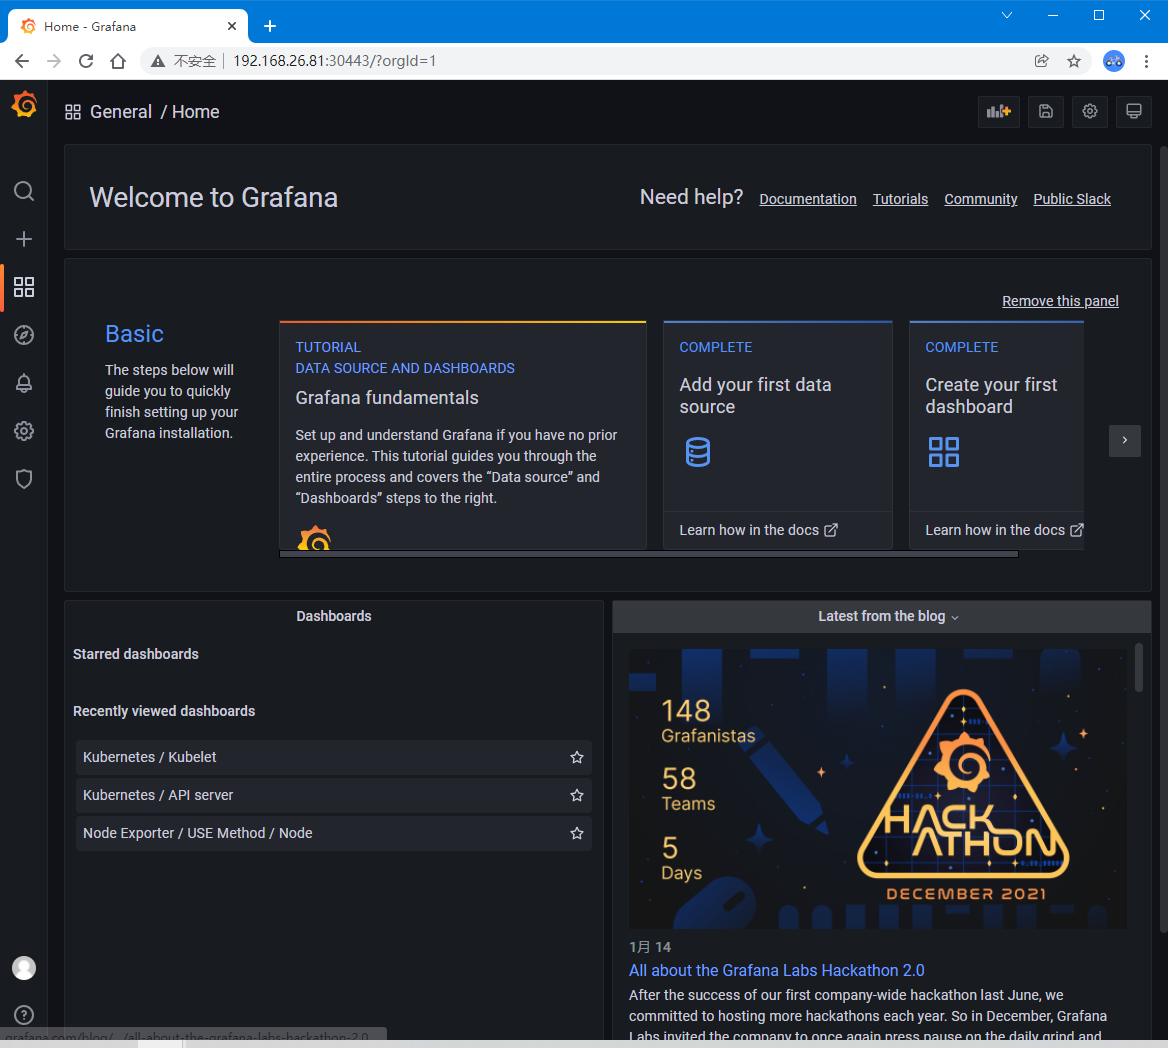
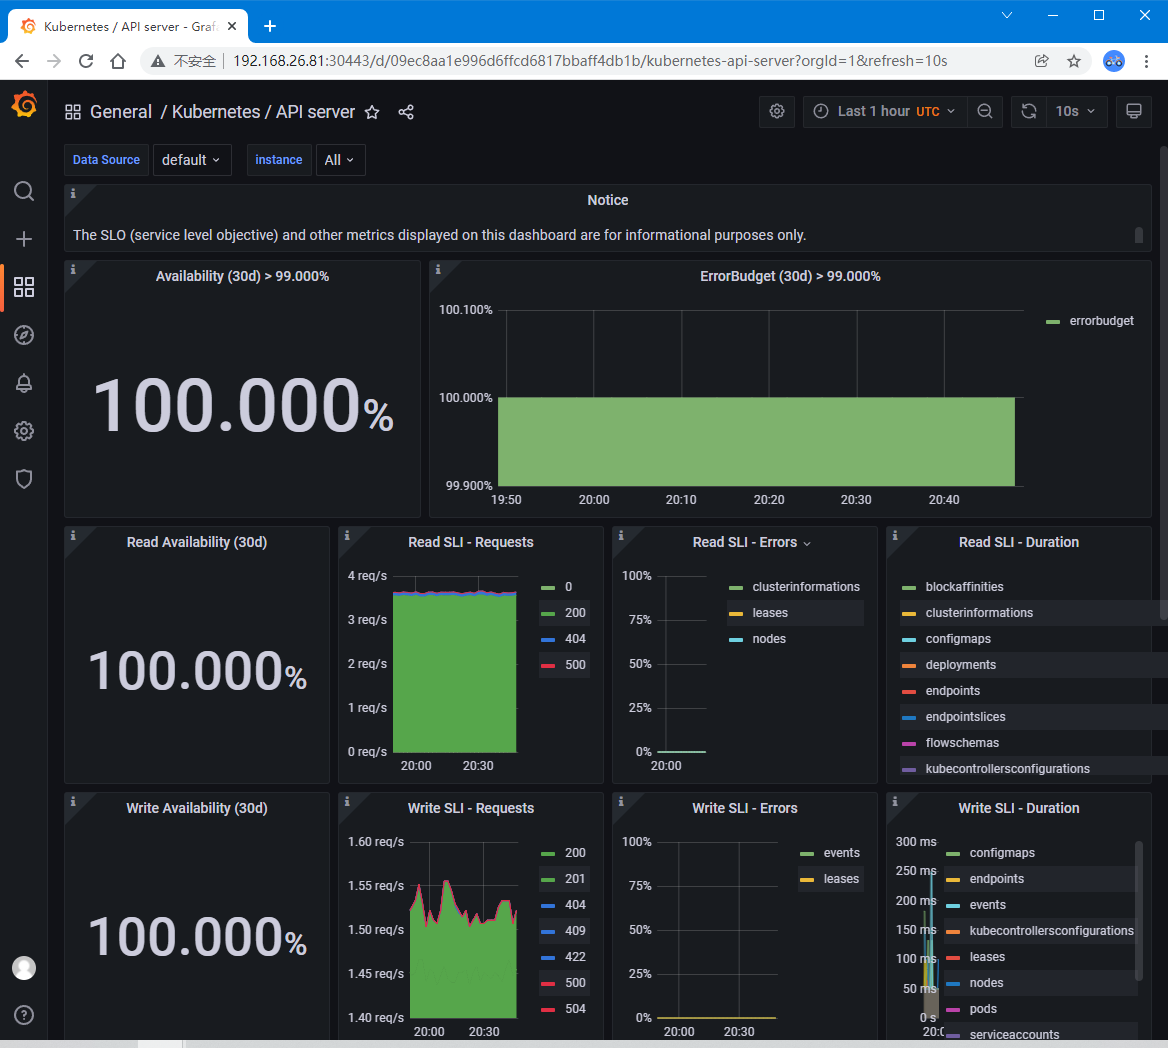
得到用户名密码:admin/prom-operator
正常登录,查看监控信息
生活加油 ^ _ ^
博文部分内容参考 © 文中涉及参考链接内容版权归原作者所有,如有侵权请告知 :)
© 2018-至今 liruilonger@gmail.com , 保持署名-非商用-相同方式共享(CC BY-NC-SA 4.0)