HarmonyOS-Codelabs系列挑战之构建你的数据应用

人生中的三大悲剧:熟到没法做情侣,饿得不知道吃什么,困得就是睡不着。

写在前面


  • 嗯,有这样一个活动,所以搞了一个小Demo,顺便学习一个js的鸿蒙的开发方式,感兴趣的小伙伴积极参与,活动地址:HarmonyOS线上Codelabs 系列挑战赛正式开启,多重好礼等你来拿!
  • 博文主要是一些前端组件使用的一个Demo,用到chart,switch,list,swiper,tabs 等组件.
  • 整理感觉JS的开发方式比安卓要干净许多,好多都不用那么麻烦了,类似于前端UI框架一样,很方便,但是组件用起来和UI框架的比相对不是特别灵活,可能是因为适用性的问题,因为多个终端兼容

人生中的三大悲剧:熟到没法做情侣,饿得不知道吃什么,困得就是睡不着。


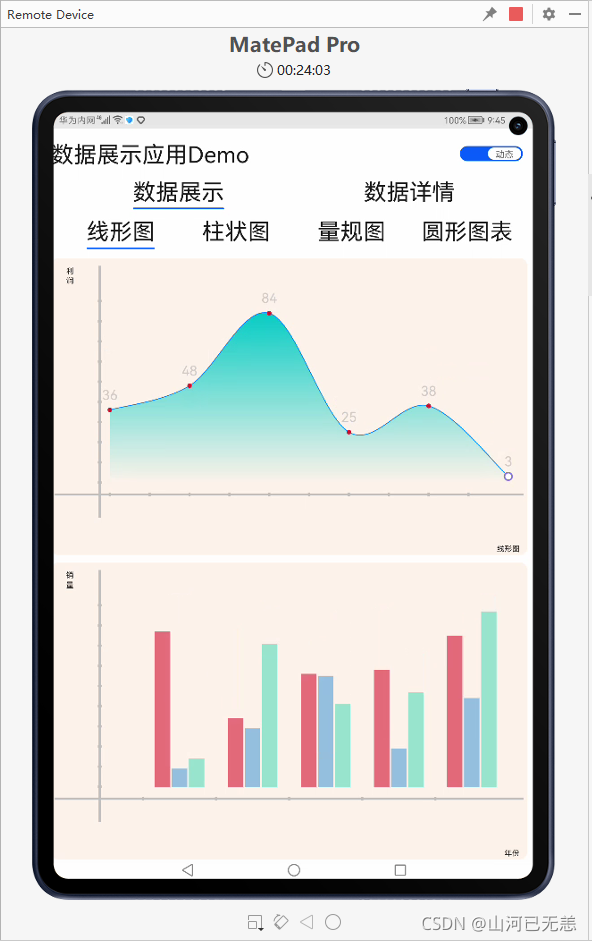
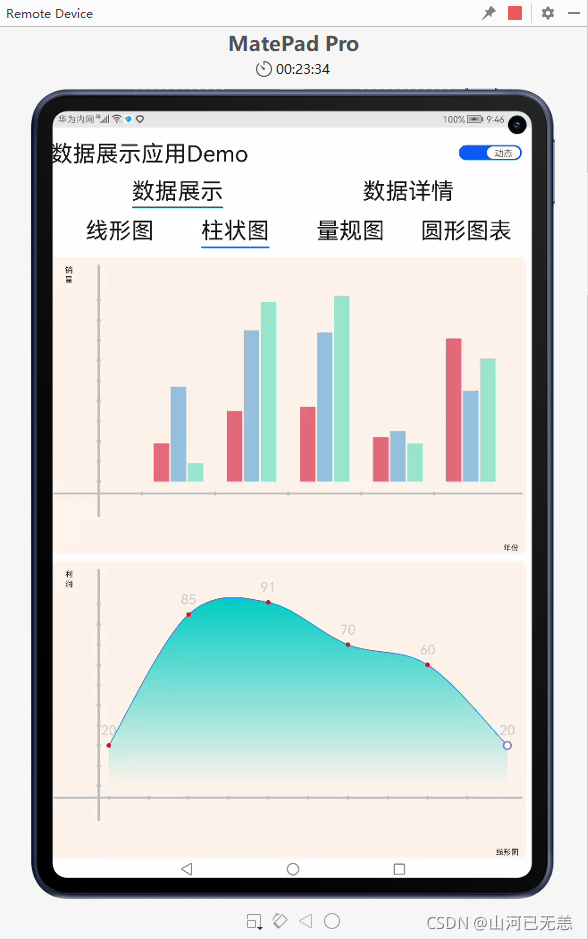
先看看效果:

在这里插入图片描述 在这里插入图片描述 在这里插入图片描述
在这里插入图片描述 数据展示这块有点垃圾,占时也没想Dao别的处理方式, 只是用list循环了一个线性图的数据,时间原因,有时间在搞一下

官方Demo

整体上是在官方的Demo基础上做的,这里把官方的Demo放在这里,感兴趣小伙伴可以看看:【JS基础组件】switch、chart的使用

下面开始愉快尝试

步骤
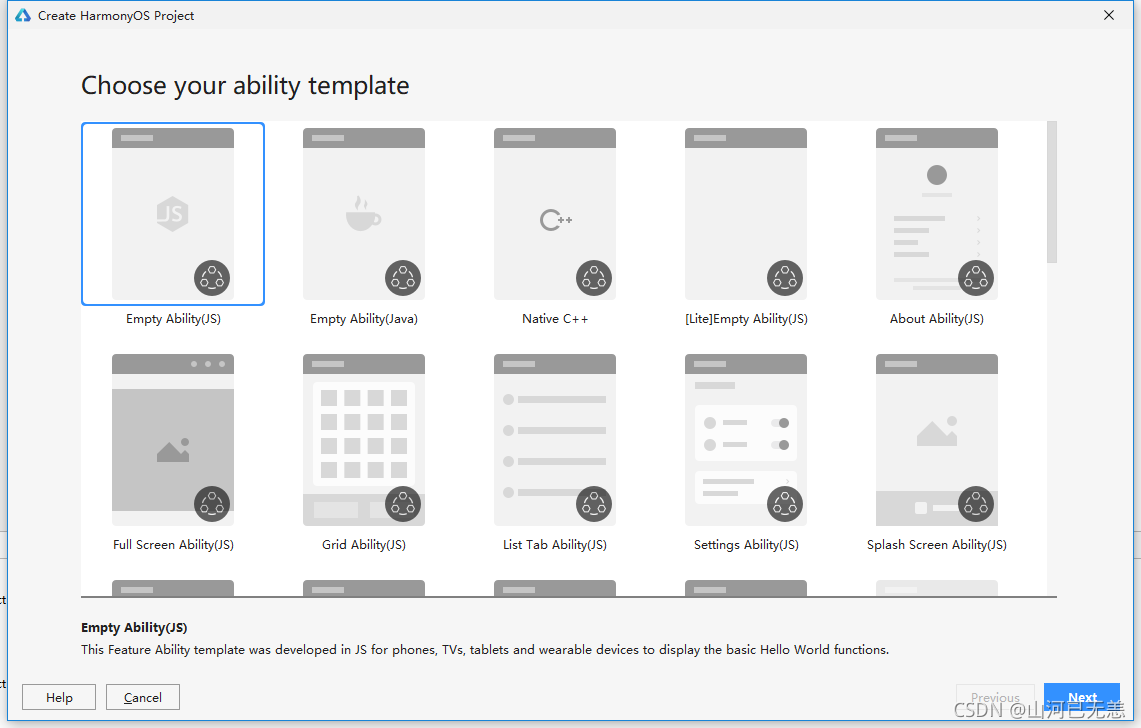
新建项目
在这里插入图片描述
在这里插入图片描述
连接模拟器
在这里插入图片描述

代码编写

主要是pages文件中
在这里插入图片描述

index.js

1
2
3
4
5
6
7
8
9
10
11
12
13
14
15
16
17
18
19
20
21
22
23
24
25
26
27
28
29
30
31
32
33
34
35
36
37
38
39
40
41
42
43
44
45
46
47
48
49
50
51
52
53
54
55
56
57
58
59
60
61
62
63
64
65
66
67
68
69
70
71
72
73
74
75
76
77
78
79
80
81
82
83
84
85
86
87
88
89
90
91
92
93
94
95
96
97
98
99
100
101
102
103
104
105
106
107
108
109
110
111
112
113
114
115
116
117
118
119
120
121
122
123
124
125
126
127
128
129
130
131
132
133
134
135
136
137
138
139
140
141
142
143
144
145
146
147
148
149
150
151
152
153
154
155
156
157
158
159
160
161
162
163
164
export default {
data: {
interval: null, // 定时器对象
showText: true, // 是否显示文本
title: "数据展示应用Demo",
textOn: '动态',
textOff: '静态',
allowScale: true, // 文本尺寸跟随系统设置字体缩放
dataLength: 30, // 数据长度
barGroup: 3, // 柱状图组数
DataSegment: {
startColor: '#8477DF',
endColor: '#97CF0A2C',
value: 50,
name: "中部",
},
DataSegments:[
{
startColor: '#8477DF',
endColor: '#97CF0A2C',
value: 20,
name: "中部",
},
{
value: 20,
name: "中部",
},
{
value: 20,
name: "西部",
},
{
startColor: '#84DF',
endColor: '#97CA2C',
value: 20,
name: "中部",
}
],
lineData: null, // 线形图数据
lineOps: { // 线形图样式
xAxis: {
min: 0,
max: 5,
display: true
},
yAxis: {
min: 0,
max: 100,
display: true
},
series: {
lineStyle: {
width: '1px',
smooth: true
},
headPoint: {
shape: 'circle',
size: 10,
strokeWidth: 2,
fillColor: '#ffffff',
strokeColor: '#8477DF',
display: true
},
loop: {
margin: 2
}
}
},
percent: 100, // 量规图进度

barData: [ // 柱状图数据
{
fillColor: '#97CF0A2C',
data: [20, 20, 99, 56, 23]
},
{
fillColor: '#6D0A7ACF',
data: [99, 88, 2, 67, 12]
},
{
fillColor: '#6A0ACFA1',
data: [56, 2, 77, 99, 78]
}
],
barOps: { // 柱状图样式

xAxis: {
min: 0,
max: 20,
display: true,
axisTick: 5
},
yAxis: {
min: 0,
max: 100,
display: true
}
}
},
// 初始化
onInit() {
this.changeLine();
},
change(e) {
if (e.checked) {
this.interval = setInterval(() => {
this.changeLine(); // 更新线形图数据
this.changeGauge(); // 更新量规图数据
this.changeBar(); // 更新柱状图数据
}, 1000)
} else {
clearInterval(this.interval);
}
},
// 更新线形图数据
changeLine() {
var dataArray = [];
for (var i = 0; i < this.dataLength; i++) {
var nowValue = Math.floor(Math.random() * 99 + 1);
var obj = {
"value": nowValue, // Y坐标
"description": nowValue + "", // 当前点的注释内容
"textLocation": "top", // 注释内容位置
"textColor": "#CDCACA", // 注释内容颜色
"pointStyle": { // 节点形状
"shape": "circle", // 形状
"size": 5, // 形状大小
"fillColor": "#CF0A2C", // 填充颜色
"strokeColor": "#CF0A2C" // 边框颜色
}
};
dataArray.push(obj);
}

this.lineData = [
{
strokeColor: '#0081ff',
fillColor: '#FF07CDC4', // 线的颜色
data: dataArray,
gradient: true,
}
]
},
// 更新量规图数据
changeGauge() {
this.percent = parseInt(this.percent) >= 99 ? 0 : parseInt(this.percent) + 1;

},
// 更新柱状图数据
changeBar() {
for (var i = 0;i < this.barGroup; i++) {
var dataArray = this.barData[i].data;
for (var j = 0;j < this.dataLength; j++) {
dataArray[j] = Math.floor(Math.random() * 99 + 1);
}
}
this.barData = this.barData.splice(0, this.barGroup + 1);
},
changes(e) {
console.log("Tab index: " + e.index);
},
}


index.css

1
2
3
4
5
6
7
8
9
10
11
12
13
14
15
16
17
18
19
20
21
22
23
24
25
26
27
28
29
30
31
32
33
34
35
36
37
38
39
40
41
42
43
44
45
46
47
48
49
50
51
52
53
54
55
56
57
58
59
60
61
62
63
64
65
66
67
68
69
70
71
72
73
74
75
76
77
78
79
80
81
82
83
84
85
86
87
88
89
90
91
92
93
94
95
96
97
98
99
100
.container{
display:flex;
flex-direction:column;
}
.line-class{
display:flex;
flex-direction:column;
}
.title{
font-size: 30px;
}


.switch-block {
margin-top: 10px;
width: 98%;
height: 50px;
display:flex;
justify-content: space-between;
}
.switch {
text-padding: 10px; /* texton/textoff中最长文本两侧距离滑块边界的距离 */
font-size: 12px;
texton-color: #5F5F5F; /* 选中字体颜色 */
textoff-color: #707070; /* 未选中字体颜色 */
}


.gauge-block, .bar-block {
margin-top: 10px;
position: relative;
width: 98%;
border-radius: 10px;
background-color: #25FAB27B;
height: 50%;
justify-content: center;
}
.chart-block{
margin-top: 20px;
position: relative;
width: 98%;
height: 90%;
border-radius: 10px;
background-color: #25FAB27B;
justify-content: center;
}
.chart-block-class{
margin-top: 20px;
position: relative;
width: 98%;
border-radius: 10px;

height: 60%;
justify-content: center;
}
.text-speed{
position: absolute;
top: 10px;
left: 20px;
width: 10px;
font-size: 10px;
}
.chart-data {
margin: 10px 5px 10px;
width: 100%;
height: 90%;
}
.text-time {
position: absolute;
font-size: 10px;
bottom: 2px;
right: 10px;
}
.gauge-block, .bar-block {
margin-top: 10px;
}

.data-gauge{
width: 200%;
height: 60%;
margin: 5px 5px 5px; /* 刻度条的宽度 */
start-angle: 0; /* 起始角度 */
total-angle: 270; /* 最大角度 */
stroke-width: 10px;
colors: #fab27b,#b2d235, #8DCF0A2C ,#D2A68DFF, #BA17A98E,#bd6758,#f58220,#5c7a29,#1a2933; /* 颜色 */
weights: 1, 1, 1,1,1,1,1,1,1; /* 颜色占比权重 */
}
.data-bar {
width: 100%;
height: 90%;
margin: 10px 5px 10px;
}
.swiper {
indicator-color: #cf2411;
indicator-size: 25px;
indicator-bottom: 20px;
indicator-right: 30px;
}

index.hml

1
2
3
4
5
6
7
8
9
10
11
12
13
14
15
16
17
18
19
20
21
22
23
24
25
26
27
28
29
30
31
32
33
34
35
36
37
38
39
40
41
42
43
44
45
46
47
48
49
50
51
52
53
54
55
56
57
58
59
60
61
62
63
64
65
66
67
68
69
70
71
72
73
74
75
76
77
78
79
80
81
82
83
84
85
86
87
88
89
90
91
92
93
94
95
96
97
98
99
100
101
102
103
104
105
106
107
108
109
110
111
112
113
114
115
116
117
118
119
120
121
122
123
124
125
126
127
128
129
<div class="container">
<div class="switch-block">
<text class="title">
{{ title }}
</text>
<switch class="switch"
showtext="{{ showText }}"
texton="{{ textOn }}"
textoff="{{ textOff }}"
allow-scale="{{ allowScale }}"
onchange="change">
</switch>
</div>
<tabs class="tabs" index="0" vertical="false" onchange="changes">
<tab-bar class="tab-bar" mode="fixed">
<text class="tab-text">数据展示</text>
<text class="tab-text"> 数据详情</text>
</tab-bar>
<tab-content class="tabcontent" scrollable="true">
<div>
<tabs class="tabs" index="0" vertical="false" onchange="changes">
<tab-bar class="tab-bar" mode="fixed">
<text class="tab-text">线形图</text>
<text class="tab-text">柱状图</text>
<text class="tab-text">量规图</text>
<text class="tab-text">圆形图表</text>
</tab-bar>
<tab-content class="tabcontent" scrollable="true">
<div class="line-class">
<div class="bar-block">
<text class="text-speed">利润</text>
<chart class="chart-data" type="line" ref="linechart" options="{{ lineOps }}"
datasets="{{ lineData }}">
</chart>
<text class="text-time">线形图</text>
</div>
<div class="bar-block">
<text class="text-speed">销量</text>
<chart class="data-bar" type="bar" id="bar-chart" options="{{ barOps }}"
datasets="{{ barData }}">
</chart>
<text class="text-time">年份</text>
</div>

</div>
<div class="line-class">
<div class="bar-block">
<text class="text-speed">销量</text>
<chart class="data-bar" type="bar" id="bar-chart" options="{{ barOps }}"
datasets="{{ barData }}">
</chart>
<text class="text-time">年份</text>
</div>
<div class="bar-block">
<text class="text-speed">利润</text>
<chart class="chart-data" type="line" ref="linechart" options="{{ lineOps }}"
datasets="{{ lineData }}">
</chart>
<text class="text-time">线形图</text>
</div>
</div>
<div class="chart-block">
<chart type="gauge" percent="{{ percent }}"></chart>
<text class="text-speed">量规图</text>
</div>

<div>
<swiper class="swiper" id="swiper" index="0" indicator="true" loop="true"
interval='10000' digital="false" autoplay="true">
<div class="swiperContent">
<div class="chart-block-class">
<chart type="rainbow" animationduration="1000000"
effects="true"
segments="{{ DataSegments }}"></chart>
<text class="text-speed">占比类圆形图表</text>
</div>
</div>
<div class="swiperContent">
<div class="chart-block-class">
<chart type="loading" segments="{{ DataSegment }}">
</chart>
<text class="text-speed">加载类圆形图表</text>
</div>
</div>
<div class="swiperContent">
<div class="chart-block-class" >
<chart type="progress" effects="true"
segments="{{ DataSegment }}">
</chart>
<text class="text-speed">进度类圆形图表</text>
</div>
</div>
</swiper>
</div>
</tab-content>
</tabs>
</div>
<div>
<div class="container">
<list class="todo-wrapper">
<list-item for="{{ barData }}" class="todo-item">
<text class="todo-title">{{ $item.data }}</text>
</list-item>

</list>
<list class="todo-wrapper">
<list-item for="{{ lineData.data }}" class="todo-item">
<text class="todo-title">{{ $item.value }}</text>
</list-item>
</list>
</div>

<!-- <text class="title">
{{ barData }}
</text>
<text class="title">
{{ lineData }}
</text>

<text class="title">
{{ DataSegment }}
</text>-->
</div>
</tab-content>
</tabs>
</div>

</div>
发布于

2021-09-25

更新于

2023-06-21

许可协议

评论
Your browser is out-of-date!

Update your browser to view this website correctly.&npsb;Update my browser now

×