基于华为云欧拉操作系统(HCE OS)单节点容器化部署(Prometheus、node-exporter、Grafana)应用性能监控平台

不必太纠结于当下,也不必太忧虑未来,当你经历过一些事情的时候,眼前的风景已经和从前不一样了。——村上春树

写在前面


不必太纠结于当下,也不必太忧虑未来,当你经历过一些事情的时候,眼前的风景已经和从前不一样了。——村上春树


创建一个专用网络,这个网络一般是业务对应网络

1
2
[root@ecs-hce ]# docker network create oa-net
8858411315a892cd61bbe8b31411595dd8b013792fd05ab68806f3ca5572c3a7

部署 Prometheus

下载 Prometheus 镜像, 查看 Prometheus 镜像

1
2
3
4
5
6
7
8
9
10
11
12
13
14
15
16
17
18
19
[root@ecs-hce ~]# cd ~ && docker pull prom/prometheus
Using default tag: latest
latest: Pulling from prom/prometheus
9fa9226be034: Pull complete
1617e25568b2: Pull complete
0af4f5a1aba4: Pull complete
524450aac7ac: Pull complete
3427b0266353: Pull complete
87f5816afa35: Pull complete
fe81a20504a7: Pull complete
bfac845c5ca1: Pull complete
6c1aa870016a: Pull complete
6126ba6f9b4f: Pull complete
68d61c64cf66: Pull complete
5e5897603b11: Pull complete
Digest: sha256:beb5e30ffba08d9ae8a7961b9a2145fc8af6296ff2a4f463df7cd722fcbfc789
Status: Downloaded newer image for prom/prometheus:latest
[root@ecs-hce ~]# docker images|grep prometheus
prom/prometheus latest 2a72b385beaf 3 weeks ago 250MB

启动 Prometheus 容器, 这里需要注意端口和网络

1
2
[root@ecs-hce ~]# docker run -id --name=prom --network=oa-net -p  9090:9090 prom/prometheus
b1f8fb907b6963e84df3e9ca1cb7e190d9089e582ebff20956c33321fcbd219c

验证 Prometheus,在浏览器输入 EIP:9090 访问 Prometheus

在这里插入图片描述

在这里插入图片描述

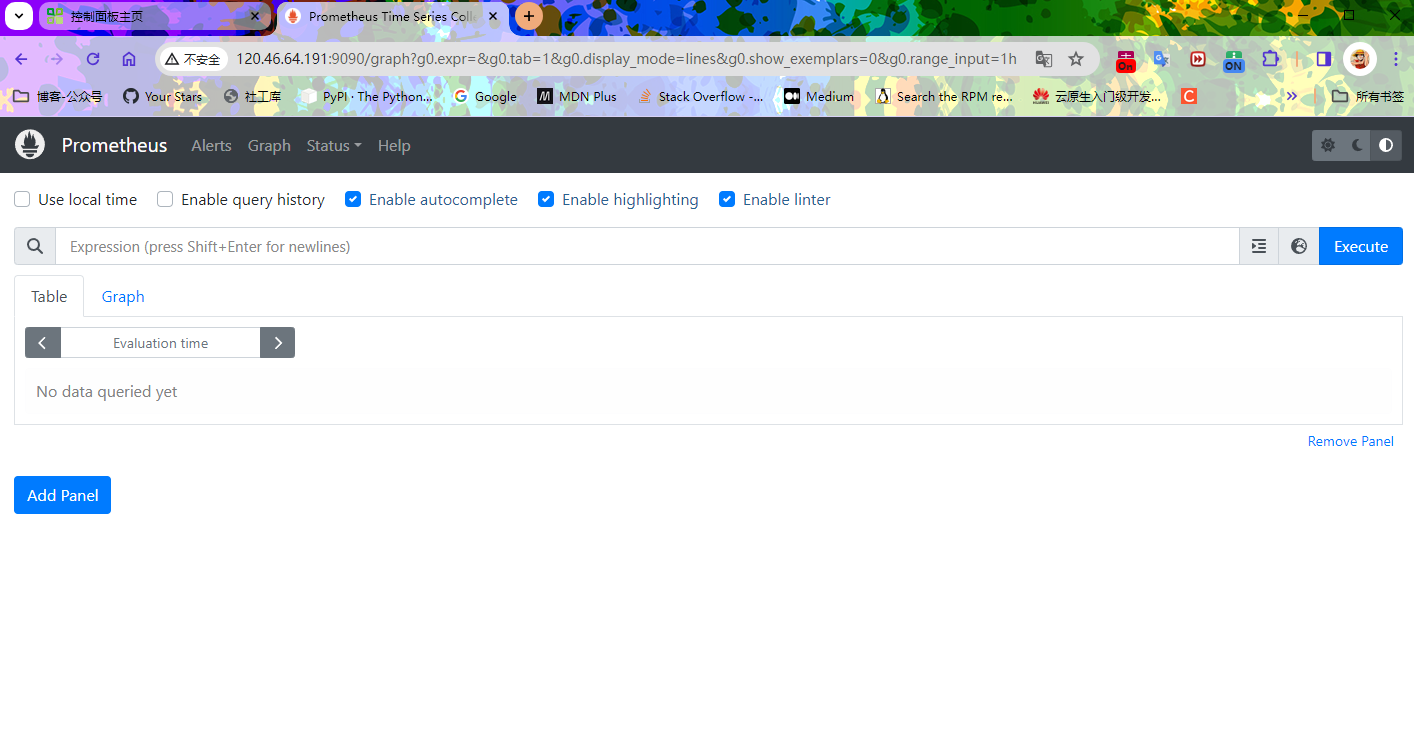
点击 Endpoint 下的链接,此时会发现页面无法访问,需要修改配置文件

1
2
3
4
5
6
7
8
9
10
11
12
13
14
[root@ecs-hce ~]# mkdir prometheus
[root@ecs-hce ~]# docker cp prom:/etc/prometheus/prometheus.yml ./prometheus
[root@ecs-hce ~]# vim prometheus/prometheus.yml

```yaml
scrape_configs:
# The job name is added as a label `job=<job_name>` to any timeseries scraped from this config.
- job_name: "prometheus"

# metrics_path defaults to '/metrics'
# scheme defaults to 'http'.

static_configs:
- targets: ["localhost:9090"]

修改 targets 对应的值为 eip:9090,并且保存退出

1
2
3
4
5
6
7
8
9
scrape_configs:
# The job name is added as a label `job=<job_name>` to any timeseries scraped from this config.
- job_name: "prometheus"

# metrics_path defaults to '/metrics'
# scheme defaults to 'http'.

static_configs:
- targets: ["120.46.64.191:9090"]

停止 prom 容器,删除 prom 容器,重新启动 Prometheus 容器

1
2
3
4
[root@ecs-hce ~]# docker stop prom
prom
[root@ecs-hce ~]# docker rm prom
prom

需要注意 -v /root/prometheus/prometheus.yml:/etc/prometheus/prometheus.yml,这里直接映射的文件

1
2
3
[root@ecs-hce ~]# docker run -id --name=prom --network=oa-net -p  9090:9090 -v /root/prometheus/prometheus.yml:/etc/prometheus/prometheus.yml  prom/prometheus
08905b1011feb7e98431f53e53eadf8f5bb1ce6d44eb0894fb13b9598efa4c1f
[root@ecs-hce ~]#

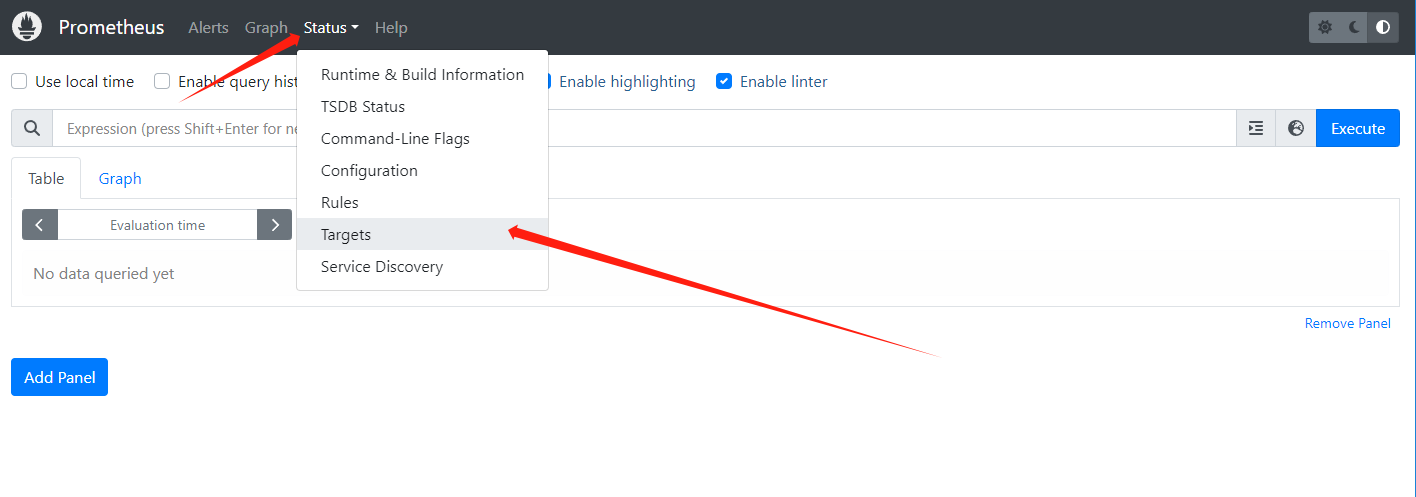
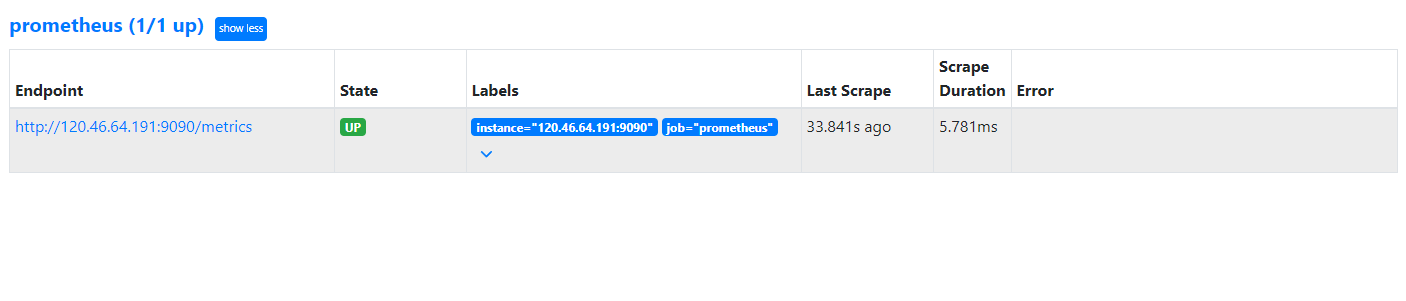
通过 EIP:9090 访问 Prometheus,并进入 Status 选项下 Targets 页面

在这里插入图片描述

部署 node-exporter

下载 node-exporter 镜像

1
2
3
4
5
6
7
8
[root@ecs-hce ~]# docker pull prom/node-exporter
Using default tag: latest
latest: Pulling from prom/node-exporter
2abcce694348: Pull complete
455fd88e5221: Pull complete
324153f2810a: Pull complete
Digest: sha256:4cb2b9019f1757be8482419002cb7afe028fdba35d47958829e4cfeaf6246d80
Status: Downloaded newer image for prom/node-exporter:latest

启动 node-exporter,注意网络和端口配置

1
2
[root@ecs-hce ~]# docker run -id --name=node-exporter --network=oa-net -p 9100:9100 prom/node-exporter
933a43e1cebbdc2192928c69b0e0f60faf84156601caed0548f08cafe979923d

修改 Prometheus 配置文件,重新启动 prometheus

1
[root@ecs-hce ~]# vim prometheus/prometheus.yml
1
2
3
4
5
6
7
8
9
10
11
12
13
14
15
scrape_configs:
# The job name is added as a label `job=<job_name>` to any timeseries scraped from this config.
- job_name: "node-exporter"
static_configs:
- targets: ["120.46.64.191:9100"]
- job_name: "prometheus"

# metrics_path defaults to '/metrics'
# scheme defaults to 'http'.

static_configs:
- targets: ["120.46.64.191:9090"]
[root@ecs-hce ~]# docker restart prom
prom
[root@ecs-hce ~]#

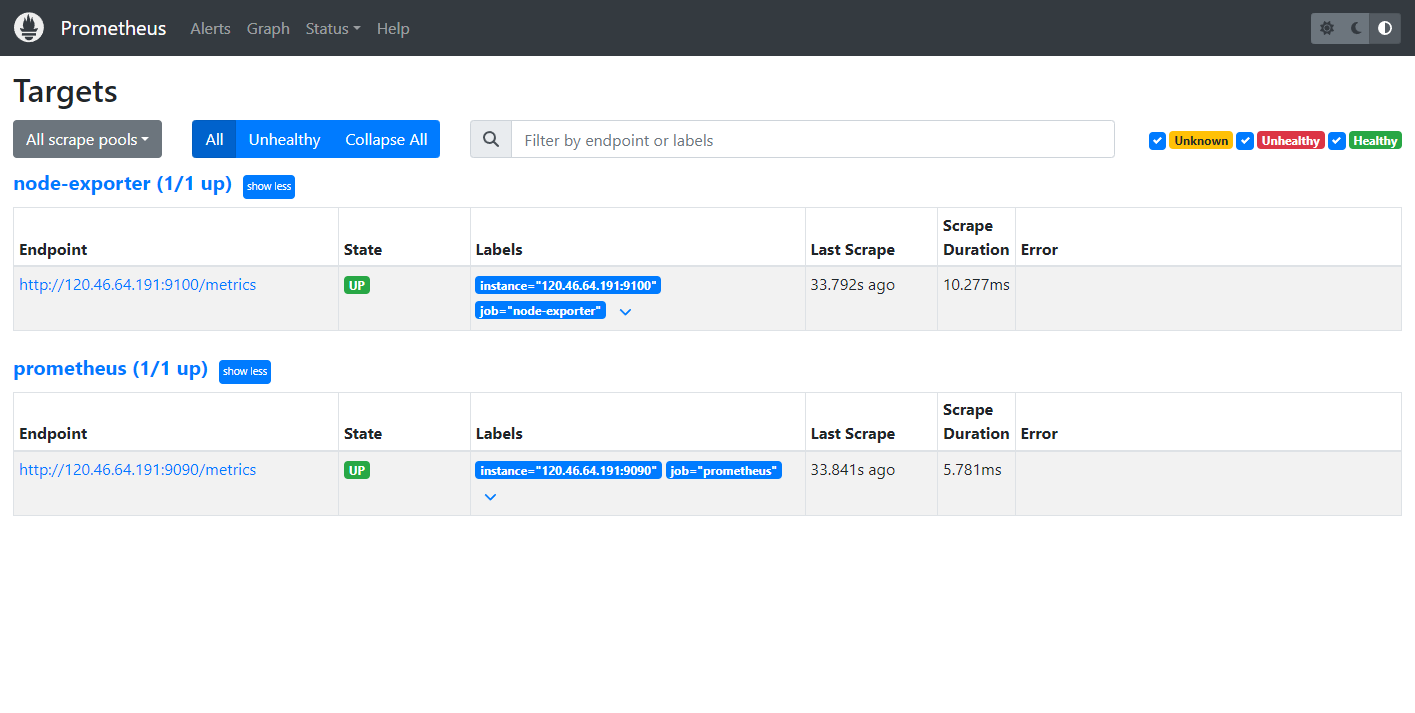
通过 EIP:9090 访问 Prometheus,在 Status—Targets 页面下,可以看到新配置的 node-exporter 数据源。

在这里插入图片描述

部署 Grafana

下载 Grafana 镜像

1
2
3
4
5
6
7
8
9
10
11
12
13
14
15
16
17
18
19
20
21
22
[root@ecs-hce ~]# docker pull grafana/grafana
Using default tag: latest
latest: Pulling from grafana/grafana
96526aa774ef: Pull complete
c7ba78600384: Pull complete
c27e091f8ead: Pull complete
1d06c4d0ba22: Pull complete
183afb97c8c4: Pull complete
409b84eddcee: Pull complete
10a0006e04fc: Downloading [==========> ] 11.79MB/53.8MB
24decdaaac3e: Download complete
10a0006e04fc: Pull complete
24decdaaac3e: Pull complete
e178ee908fb8: Pull complete
d42dc690a758: Pull complete
Digest: sha256:7567a7c70a3c1d75aeeedc968d1304174a16651e55a60d1fb132a05e1e63a054
Status: Downloaded newer image for grafana/grafana:latest
[root@ecs-hce ~]#
[root@ecs-hce ~]#
[root@ecs-hce ~]# docker images grafana/grafana
REPOSITORY TAG IMAGE ID CREATED SIZE
grafana/grafana latest 2fec87cd4362 2 weeks ago 406MB

启动 Grafana 容器,注意这里的端口和网络,grafana 并不需要和上面的组件放到同一个网络里面

1
2
3
[root@ecs-hce ~]# docker run -d --name grafana -p 3000:3000 grafana/grafana
ab78373b51595e6de467d2e42f119309f9a301ff31e7ed89525334f7e0ed5e47
[root@ecs-hce ~]#

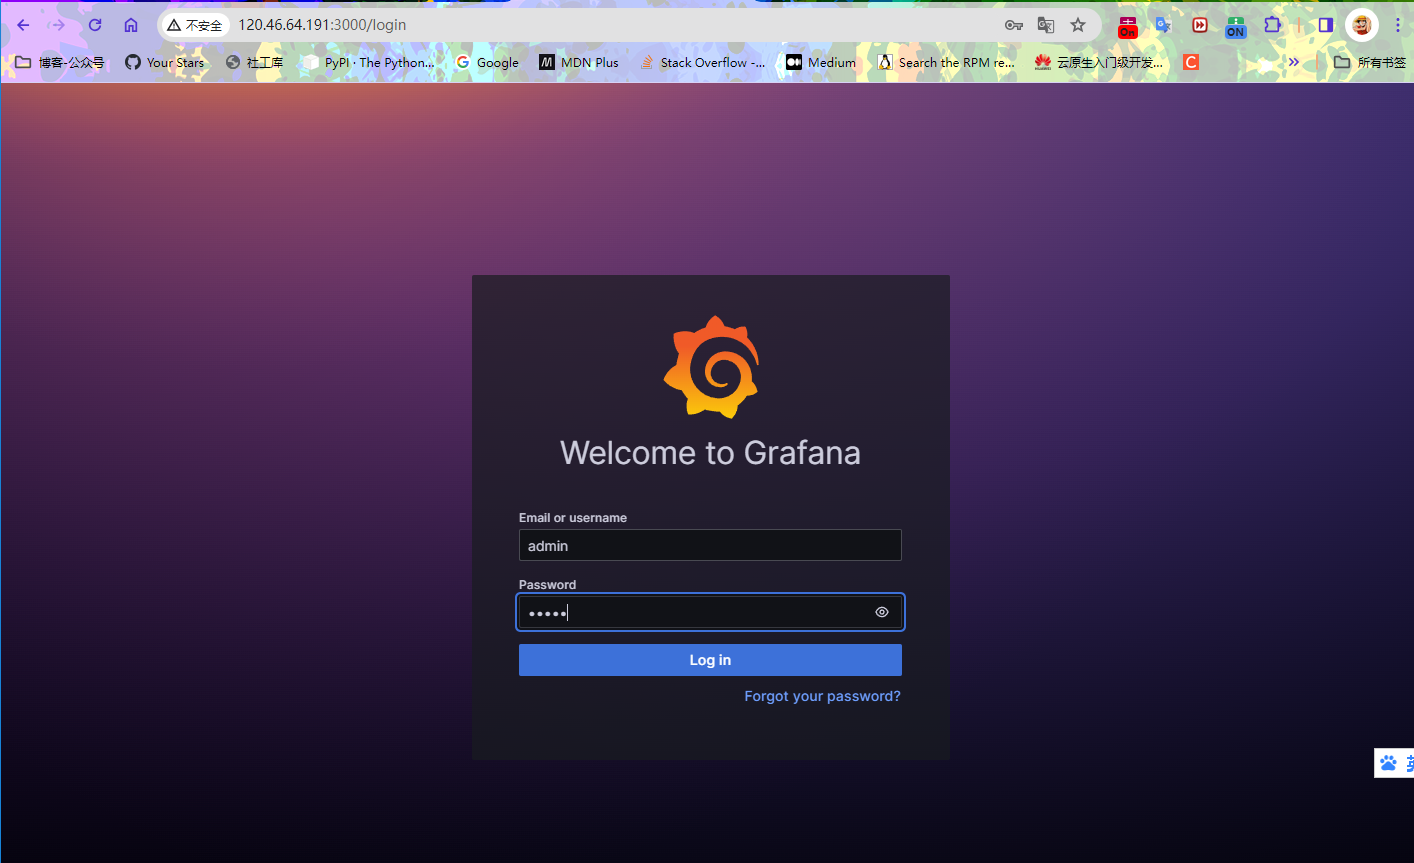
通过 EIP:3000 访问 Grafana,初始账号为 admin,密码为 admin

在这里插入图片描述

登录后,DATA SOURCE,增加数据源

在这里插入图片描述

到这里容器化部署Prometheus、node-exporter、Grafana就完成了,之后可以根据情况配置面板

© 文中涉及参考链接内容版权归原作者所有,如有侵权请告知 :)


https://edu.huaweicloud.com/certificationindex/developer/9bf91efb086a448ab4331a2f53a4d3a1


© 2018-2024 liruilonger@gmail.com, All rights reserved. 保持署名-非商用-相同方式共享(CC BY-NC-SA 4.0)

基于华为云欧拉操作系统(HCE OS)单节点容器化部署(Prometheus、node-exporter、Grafana)应用性能监控平台

https://liruilongs.github.io/2024/02/07/华为云/基于华为云欧拉操作系统-HCE-OS-容器化部署-Prometheus、node-exporter、Grafana-应用性能监控平台/

发布于

2024-02-07

更新于

2024-02-15

许可协议

评论
Your browser is out-of-date!

Update your browser to view this website correctly.&npsb;Update my browser now

×